 Microservice architecture has become the new model for building modern-day applications. While decoupled services are easy to scale and manage, increasing interactions between those services have created a new set of problems. It’s no surprise that debugging was listed as a major challenge in the annual state of microservices report.
Editorial note: This post was initially published on Iamondemand’s blog. You can check out the original here, at their site.
When your systems are distributed, various things can go wrong. Even if you’ve written the perfect code, a node may fail, a connection may timeout, or participant servers may act arbitrarily. The bottom line is that things will break. And when they do, you want to be able to identify and fix the problem as soon as possible before it alters the entire system’s performance, or affects customers or your organization’s reputation. For this reason, we need observability to run today’s services and infrastructure.
People have varying knowledge of what observability means. For some engineers, it’s the old wine of monitoring in a pristine bottle. For others, it’s an umbrella concept that includes log analysis, trace analysis for distributed systems, visualization, and alerts management.
Honeycomb, in its Guide to Achieving Observability, also defines observability as the ability to ask arbitrary questions about your production environment without having to know beforehand what you wanted to ask. Despite the variability in these definitions, they both explain the overarching goal of observability, which is to achieve better, unprecedented visibility into systems.
Observability is a system that enables you to understand what’s really happening in your software, from the outside. An observable system provides all the information you need in real time to address the day-to-day questions you might have about a system. It also enables you to navigate from effect to cause whenever the system develops a fault.
An effective observability solution may address questions like:
- Why is “y” broken?
- What went wrong during the release of feature “x”?
- Why has system performance degraded over the past few months?
- What did my service look like at point “y”?
- Is this system issue affecting specific users or all of them?
You may ask why you should put in the effort to make your systems observable. I discuss the reasons in the following sections.
The Unpredictability of Distributed Systems
A distributed system comprises multiple components located on different networked computers, communicating and coordinating their actions by passing messages from one to another. The inherent integrations and nature of distributed systems lead to “layers of distinct ownership,” which are sometimes challenging to manage. By implementing observability across a development environment, you’re able to understand your system’s failure modes and trace issues to their root cause.
The Need to Always Maintain Software
After an application is designed, implemented, and launched, it also has to be maintained. Development teams need to continuously adapt to changing customer behavior and ensure that the application runs at peak performance levels and works as expected. An observable system makes application maintenance easier. You’re able to easily identify errors, fix bugs that might arise, customize the application to users’ needs, and eventually improve the app’s performance.
The Need to Speed Up Code Development and Deployment
DevOps is about speed: faster application development and shipments, more immediate updates, and continuous development—all of which lead to a shortened development lifecycle and provide faster and continuous delivery with high software quality. If your development teams cannot identify and address issues before they occur, or they cannot react quickly to changes, it may be difficult to speed up the time to market. By leveraging a strong observability platform, software development teams can increase speed and effectiveness in deploying code, updating, and tracking changes.
In a nutshell, observability offers many benefits to managers and engineers. It also plays a vital role in an organization—especially in maintaining and enhancing a system’s overall architecture and performance. As distributed systems become more complex, engineers can infer the system’s internal states through externally available knowledge, including tracing data, log data, monitoring data, and so on.
Pillars of Observability
Observability is about instrumenting systems to gather useful data that tells you when and why systems are behaving in a certain way. Whenever a system develops a fault, you should first examine telemetry data to better understand why the error occurred.
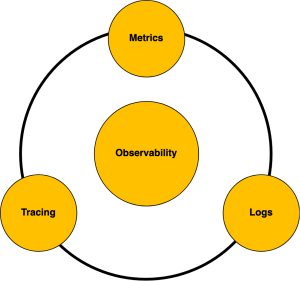
The following telemetry data—commonly referred to as the pillars of observability—are key to achieving observability in distributed systems:
- Logs
- Metrics
- Tracing
 Figure 1: Three pillars of observability
Logs
Logs are structured and unstructured lines of text a system produces when certain codes run. In general, you can think of a log as a record of an event that happened within an application. Logs help uncover unpredictable and emergent behaviors exhibited by components of microservices architecture.
They’re easy to generate and instrument. And most application frameworks, libraries, and languages come with support for logging. Virtually every component of a distributed system generates logs of actions and events at any point.
Log files provide comprehensive system details, such as a fault, and the specific time when the fault occurred. By analyzing the logs, you can troubleshoot your code and identify where and why the error occurred. Logs are also useful for troubleshooting security incidents in load balancers, caches, and databases.
Metrics
Metrics are a numerical representation of data that can be used to determine a service or component’s overall behavior over time. Metrics comprise a set of attributes (e.g., name, value, label, and timestamp) that convey information about SLAs, SLOs, and SLIs.
Unlike an event log, which records specific events, metrics are a measured value derived from system performance. Metrics are real time-savers because you can easily correlate them across infrastructure components to get a holistic view of system health and performance. They also enable easier querying and longer retention of data.
You can gather metrics on system uptime, response time, the number of requests per second, and how much processing power or memory an application is using, for example. Typically, SREs and ops engineers use metrics to trigger alerts whenever a system value goes above a specified threshold.
For example, let’s say you want to monitor the requests per second in an HTTP service. You notice an abrupt spike in traffic, and you want to know what’s happening in your system. Metrics provide deeper visibility and insight that help you understand the cause of the spike. The spike could be due to an incorrect service configuration, malicious behavior, or issues with other parts of your system. In addition to providing visibility, you can also use the information to detect and determine the severity of issues.
Trace
Although logs and metrics might be adequate for understanding individual system behavior and performance, they rarely provide helpful information for understanding the lifetime of a request in a distributed system. To view and understand the entire lifecycle of a request or action across several systems, you need another observability technique called tracing.
A trace represents the entire journey of a request or action as it moves through all the nodes of a distributed system. Traces allow you to profile and observe systems, especially containerized applications, serverless architectures, or microservices architecture. By analyzing trace data, you and your team can measure overall system health, pinpoint bottlenecks, identify and resolve issues faster, and prioritize high-value areas for optimization and improvements.
Traces are an essential pillar of observability because they provide context for the other components of observability. For instance, you can analyze a trace to identify the most valuable metrics based on what you’re trying to accomplish, or the logs relevant to the issue you’re trying to troubleshoot.
Tracing is better suited for debugging and monitoring complex applications that contend for resources (e.g., a mutex, disk, or network) in a nontrivial manner. Tracing provides quick answers to the following questions in distributed software environments:
- Which services have inefficient or problematic code that should be prioritized for optimization?
- How is the health and performance of services that make up a distributed architecture?
- What are the performance bottlenecks that could affect the overall end-user experience?
Although logs, traces, and metrics each serve their own unique purpose, they all work together to help you better understand the performance and behavior of distributed systems. If your organization already uses microservice or serverless architecture, or if they plan to adopt containers and microservices, a combination of all the telemetry data will provide the detailed information needed to understand and debug your system.
Implementing Observability
The fundamental process of implementing an observability-centric culture across your development environment relies on adopting tools that enable you to support and derive insights from the pillars of observability outlined above.
First, you need to select a modern observability platform that perfectly fits your specific needs. A full-stack platform that condenses all the telemetry data from metrics, logs, and traces into a visual, intuitive, and easy-to-understand dashboard can be a good starting point. (Just be careful not to choose a platform that locks you into a specific cloud platform.)
Then, you need to identify and monitor metrics related to issues you’ve already experienced and those you could likely encounter in the future.
After integrating observability into your incident management process, the next step is to establish an observability-centric culture across your organization. Absent of this, you won’t be able to get the best out of tracing, metrics, and log management. No amount of observability tooling can serve as a substitute for sound engineering instincts and intuition.
By selecting the right observability platform, getting a connected view of your system’s performance data in a singular view, and establishing an observability culture, you’ll be able to identify issues faster, understand what caused them, and eventually, build customer-focused products at greater speeds.
Conclusion
As the adoption of microservices and containers increases, engineers and managers need to develop a culture of observability. Doing so will help your teams get the best out of your investments in the cloud. It will help you form a continuous innovation culture that delivers high-end software to customers.
It doesn’t matter if you’re a seasoned DevOps pro or just getting started with observability. Understanding the three pillars of observability is an essential part of developing an observability-centric culture. Practice what you’ve learned in this post, and you’ll be on your way to achieving observability in distributed systems.